Trip Intelligence
Your personal fishing data scientist.

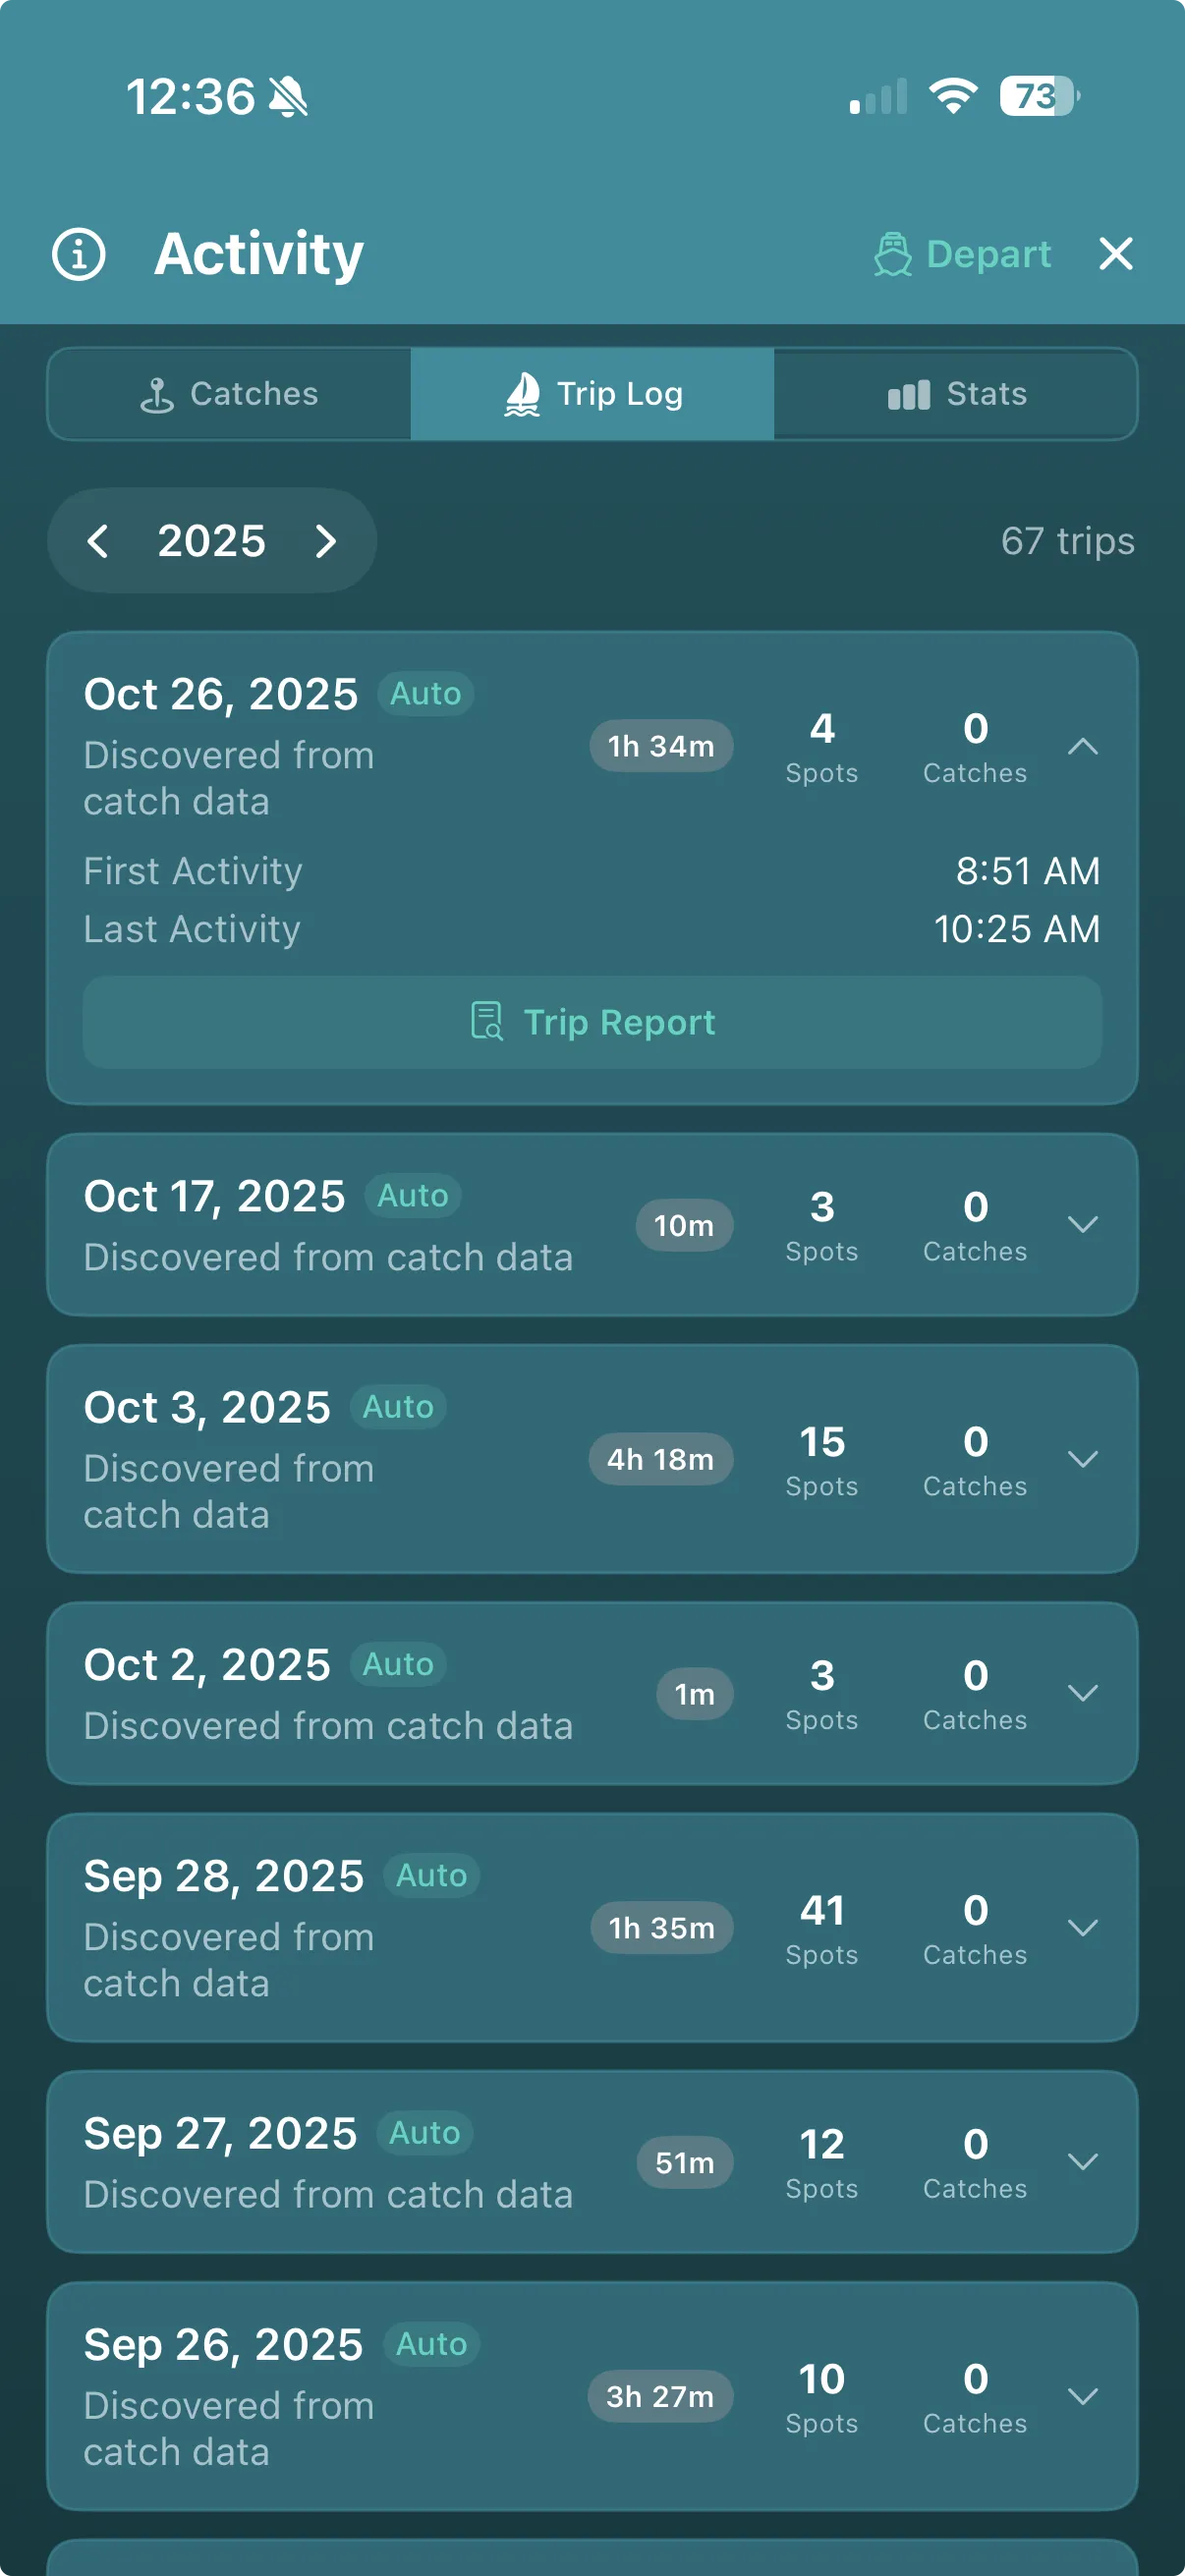
Auto-discovered Trip Log with year navigation and per-trip stats
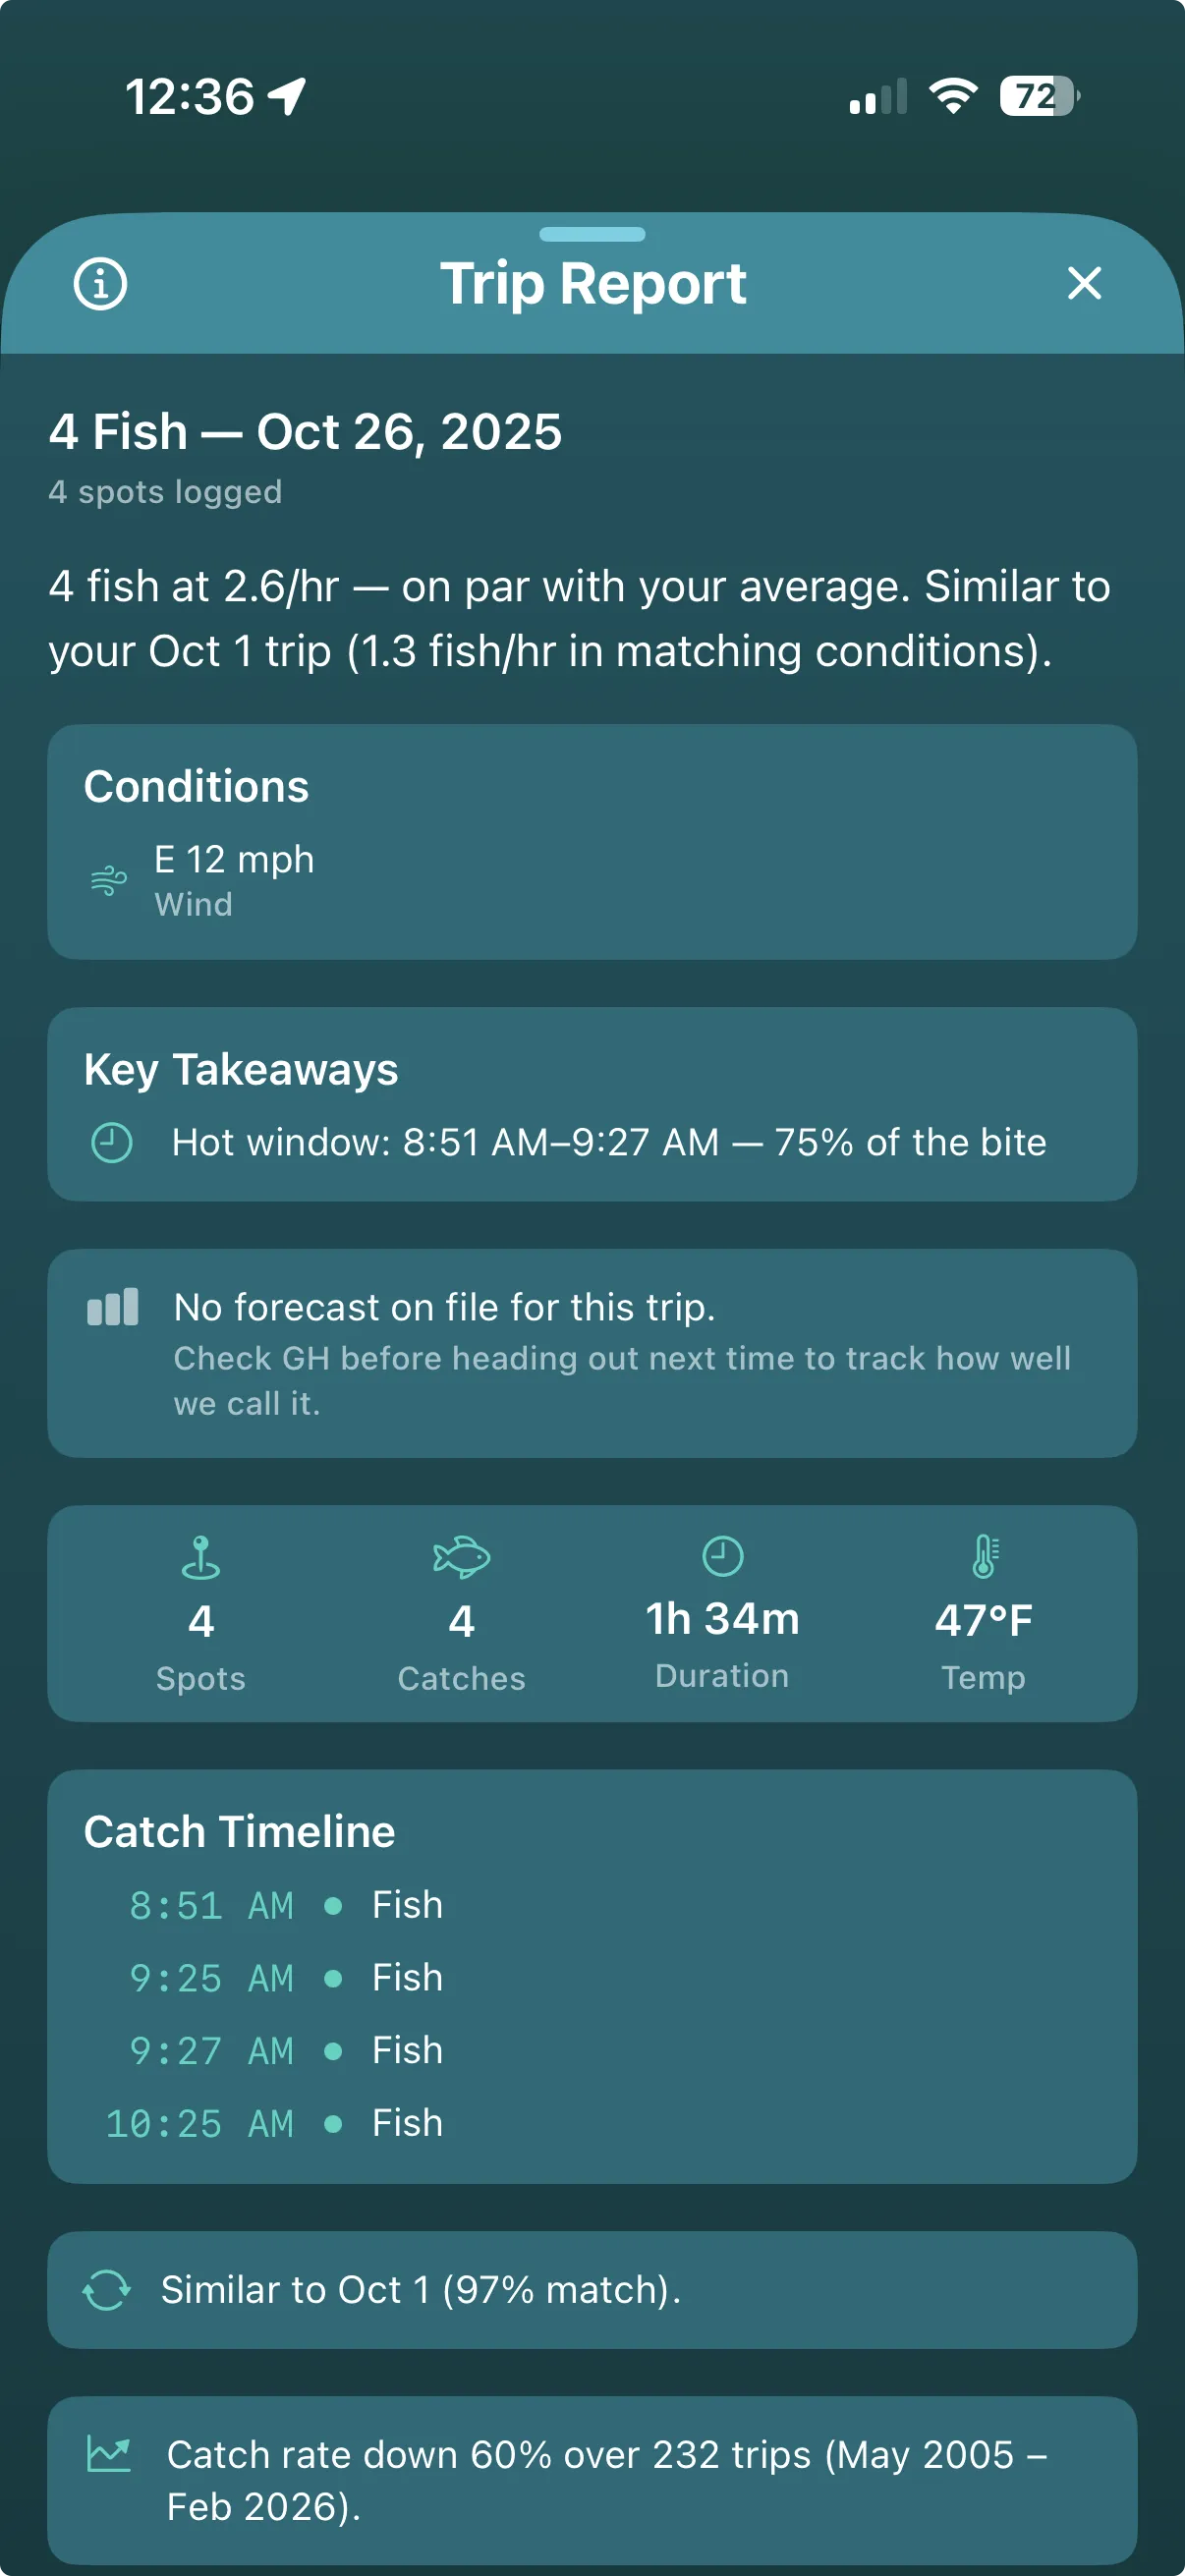
Full Trip Report with conditions, timeline, and cross-trip comparison
Every Trip Tells a Story
Most fishing apps show you what happened. Get Hooked! shows you what it means.
Trip Intelligence transforms raw fishing data — catches, conditions, locations, timestamps — into an intelligent narrative brief. Every outing becomes a learning opportunity. The more you fish, the smarter it gets. And the best part? Trips discover themselves. No start/stop buttons. No trip logging forms. Just fish, and the system finds the patterns.
Zero-Friction Trip Discovery
Trips appear automatically. No manual entry required.
Fish Your Spots
Log catches and waypoints as you normally would
Trips Auto-Detect
The system groups your activity by date and discovers trips automatically
Reports Generate
Every trip gets a full intelligence report — conditions, timeline, insights, and grades
Float Plan trips are recognized automatically. Trips without a Float Plan are discovered from your daily waypoint logs. Either way, you get a full Trip Report.
What's in a Trip Report
A full intelligence brief for every outing, generated automatically.
Catch Breakdown
Species proportion bars, top bait used, and the best 60-minute bite window. Know what worked and when.
Catch Timeline
Chronological sequence of every catch with species, bait, weight, and exact time. See the rhythm of your day.
Conditions Snapshot
Pressure trend (start, end, direction), average temperature, and wind. The environmental context behind the catches.
Hotspot Detection
The most productive 0.5-mile zone on your trip, identified automatically. Spatial intelligence meets catch density.
Key Takeaways
5–6 plain-language insights covering timing, conditions, bait, location, and performance. The story behind the numbers.
Stats Ribbon
Spots fished, total catches, duration, best fish (weight), and temperature — all at a glance.
Cross-Trip Comparison
Every new trip is measured against your personal history.
Performance Percentile
Where does this trip rank in your top 100? "Top 18% of your 42 trips" gives you real context beyond raw fish count. You're not compared to some global average — you're compared to yourself.
Similar Trip Matching
Get Hooked! scans your entire history and finds past trips with similar pressure, temperature, wind, and location. If conditions today match a day you crushed it, the report tells you — with a match percentage.
Personal Bests
New record fish by weight or length for any species? The report flags it. Location bests too — if this was your strongest catch rate at a specific spot, you'll know.
Dual Grading System
Two grades. Two stories. One closed-loop feedback system.
Trip Grade (A–F)
How well did you fish? Your performance percentile ranked against your own history.
- A — Top 20% of your trips
- B — Top 40%
- C — Middle of the pack
- D — Below average
- F — Tough day
GH Grade (A–F)
How accurate was the forecast? Compares what Get Hooked! predicted vs. what actually happened.
- A — Forecast nailed it (within 10 pts)
- B — Close call (within 25 pts)
- C — Missed a bit (within 40 pts)
- D — Off target (within 55 pts)
- F — GH got it wrong
Trip: A · GH: A — "Prime forecast, prime result. GH nailed it."
Trip: A · GH: F — "GH said stay home. You went anyway. Crushed it."
Trip: F · GH: A — "GH warned you. You went anyway. GH was right."
Trip: F · GH: F — "GH promised prime conditions. Fish didn't cooperate."
The app owns its misses. When GH gets an F, that's the app being honest — not a judgment on you.
Closing the Loop: Forecast Report Card
Grading trips isn't just a scorecard — it's how the forecast learns.
Machine Learning, One Trip at a Time
Every graded trip feeds back into the forecast engine. The Report Card runs Pearson correlation analysis across all 12 scoring factors to discover which ones actually predict YOUR fishing success — and which ones are holding your forecast back.
After 8+ trips, if GH is consistently wrong, a calibration banner appears with an "Optimize All Weights" button. One tap rewrites your scoring weights based on real correlation data. A before/after preview shows exactly how your historical scores would change before you commit.
Per-Factor Tuning
Each graded trip shows which factor dragged the forecast score down the most. Tap to nudge any factor's weight up or down — one at a time, so you stay in control.
Per-Location Profiles
Weights are optimized per forecast spot. Your inland lake and your coastal spot learn independently — because the conditions that matter are different.
Trip Grade tells you how you did. GH Grade tells the app how IT did. The Report Card closes the loop — and your next forecast is smarter because of it.
Long-Term Progression
See yourself improve across weeks, months, and seasons.
Catch Rate Trend
Linear regression on your fish-per-hour over time. Are you improving, declining, or holding steady?
Average Size Trend
Are your fish getting bigger over the season? Size trends tracked across your full trip history.
Trophy Ratio
What percentage of your catches exceed 1.4x the species average? Trending up means you're targeting bigger fish effectively.
Species Diversity
Expanding your range or narrowing your focus? The system tracks new species appearances across your trips.
Bait Evolution
Notable shifts in your dominant bait over time. "Switched from live shiners to soft plastics in December — catch rate up 23%."
Narrative Summary
Plain-language paragraphs that dynamically adapt to your history depth. Not a template — a story that changes with every trip.
The Trip Log
Browse every trip you've ever taken, organized by year.
Year Navigation
Browse by year with a simple stepper. See your total trip count at a glance — "67 trips" in 2025.
At-a-Glance Trip Cards
Every trip shows date, source (Auto / Float Plan), duration, spots fished, catches, and activity window. Expand any card for the summary, or tap Trip Report for the full brief.
Pull to Refresh
New catches since you last checked? Pull down to re-scan your waypoints and discover any new trips.
The Wisdom Layer
Most fishing apps stop at Data ("30.12 inHg") or Information ("Pressure is rising"). Trip Intelligence reaches Wisdom — "Conditions match 3 of your best smallmouth days. Your catch rate was 2.6/hr, on par with your average. Similar to your Oct 1 trip (97% match)."
Every trip report is rooted in YOUR data, YOUR patterns, YOUR location. The more you use the app, the smarter it gets.
Ready to stop guessing and start catching?
© 2026 Hooked on Yutz. Get Hooked! is a trademark of Hooked on Yutz.