AI Forecasts & Pattern Analytics
Not generic forecasts. YOUR fishing AI.

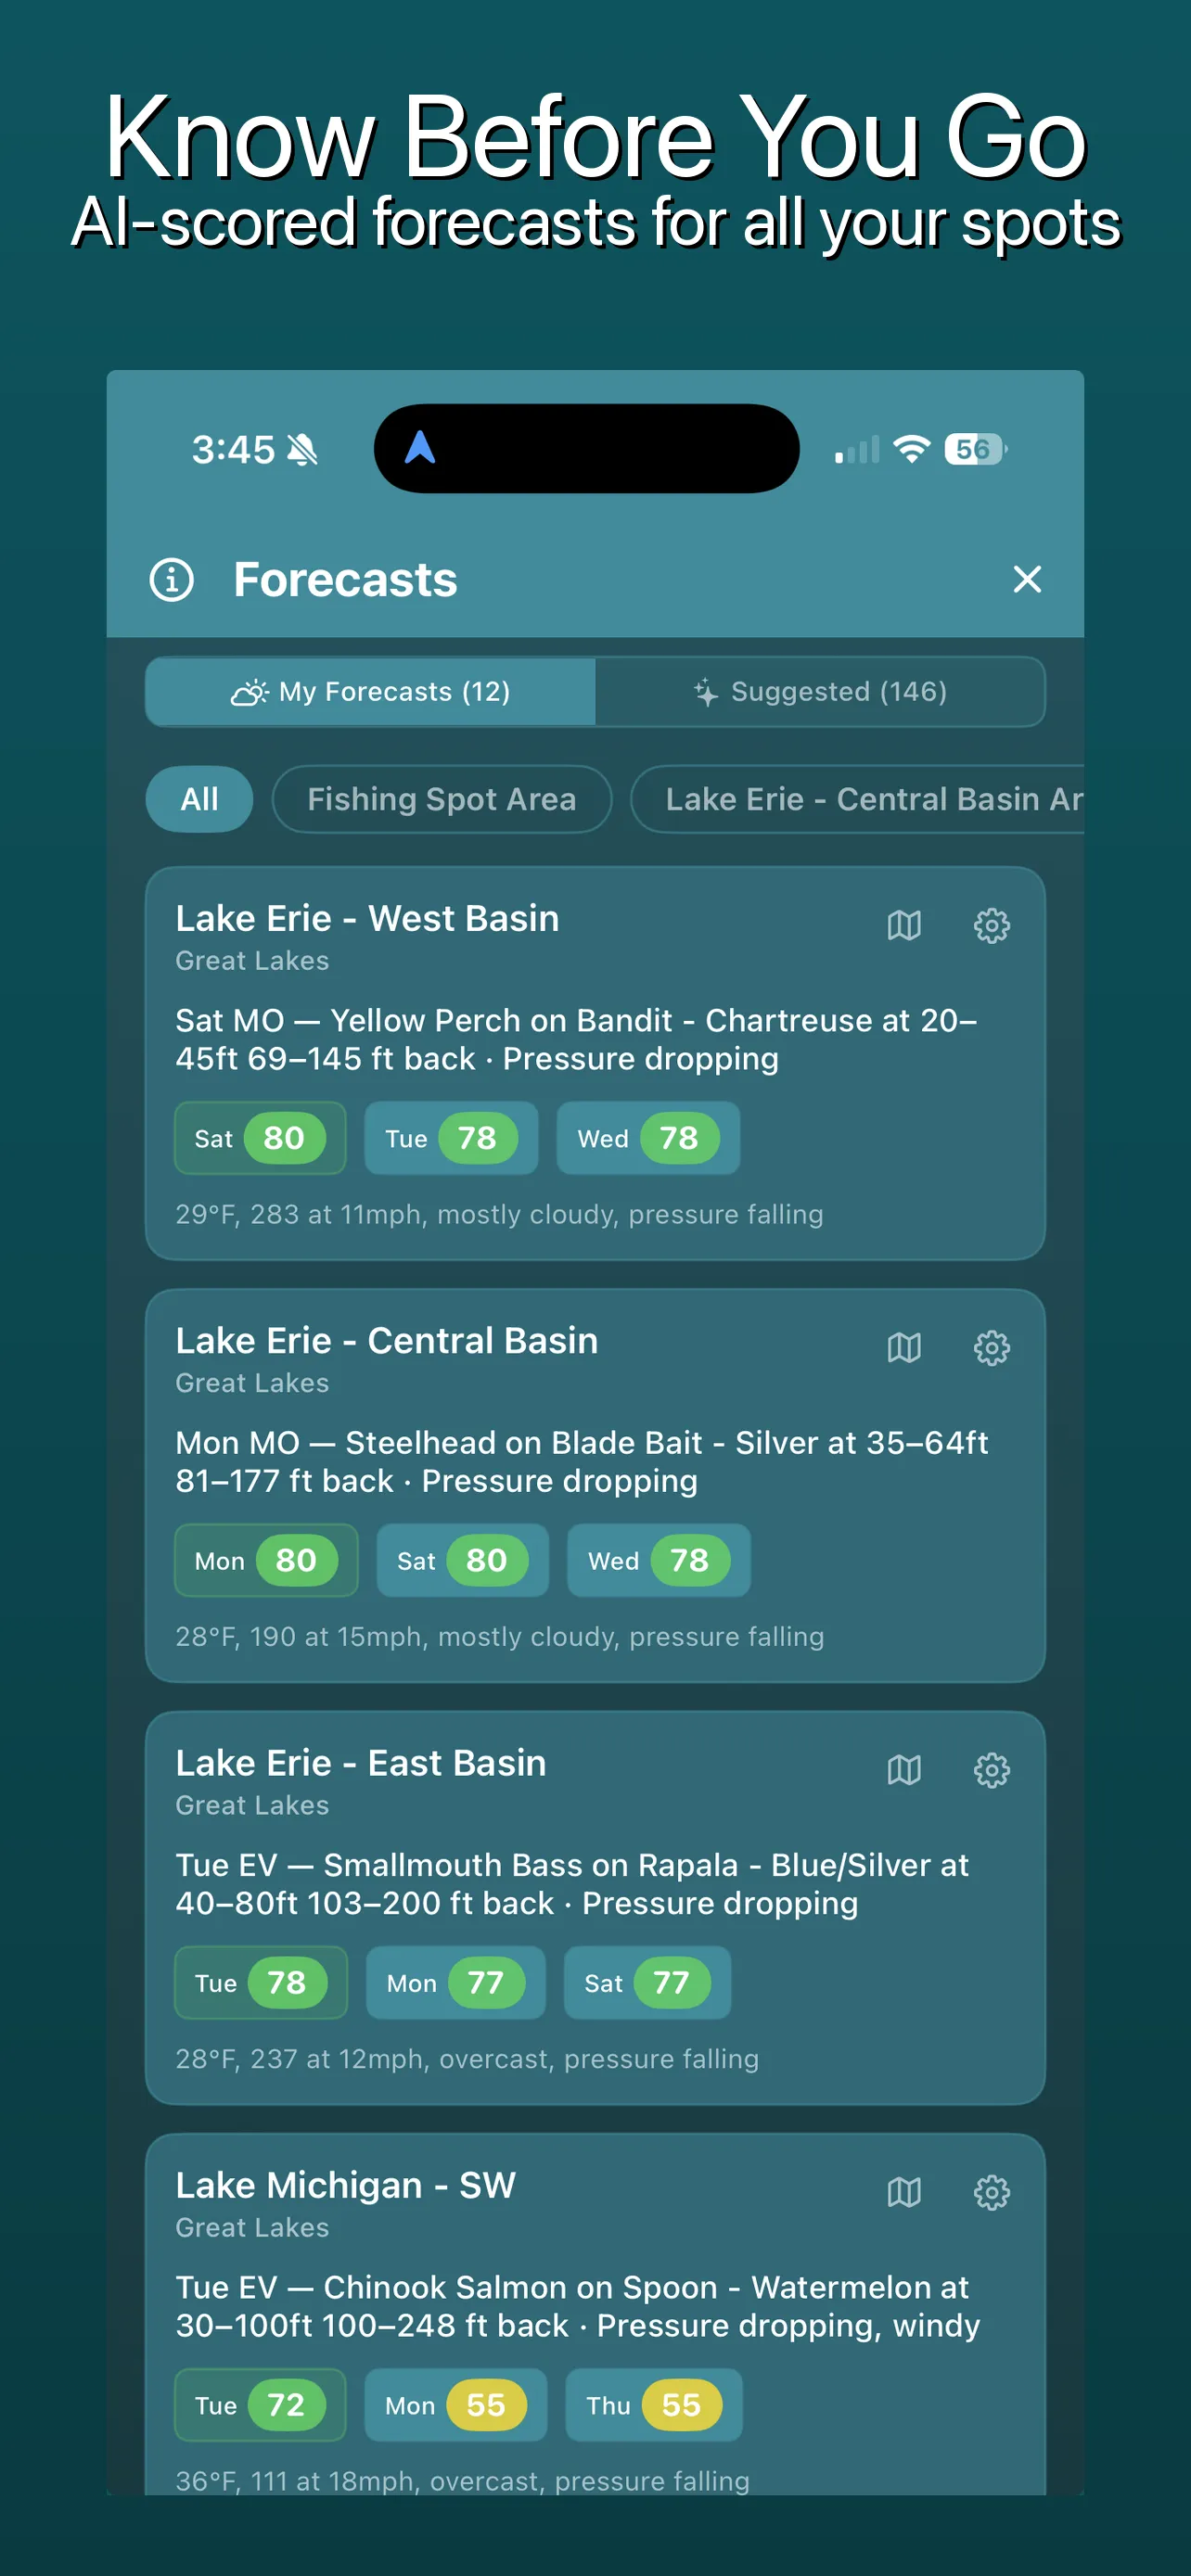
15-day forecast timeline with personalized 0-100 scores
Hourly bite windows with quality ratings and factor breakdown
From Data to Wisdom
Most fishing apps stop at Data or Information. Get Hooked! reaches Wisdom.
Data
"Barometric pressure: 30.12 inHg"
Every weather app
Information
"Pressure is rising, wind 10mph NW"
Most fishing apps
Knowledge
"Rising pressure + overcast = good smallmouth conditions"
Some premium apps
Wisdom
"Conneaut Creek matches your walleye pattern (82%). Pressure started dropping 2 hours ago — your best catches are in the first 4 hours. Try jig-and-worm, morning."
Only Get Hooked!
12 Scoring Factors
Every forecast score is built from 12 environmental and personal factors, weighted to YOUR fishing style.
1. Barometric Pressure Trends
Rising, falling, or steady — and how fast. Rapid drops trigger different species behavior than slow climbs.
2. Temperature
Species-dependent ideal ranges. What triggers bass is different from walleye or trout.
3. Wind Speed & Direction
Wind pushes baitfish, creates current, and stirs up nutrients. Direction matters as much as speed.
4. Wave / Swell Height
Wave action affects water clarity, bait movement, and safety. Integrated from marine forecast data.
5. Cloud Cover Percentage
Overcast vs. bluebird skies changes fish behavior. Some species feed more aggressively under cloud cover.
6. Precipitation & Storm Timing
Pre-front feeding frenzies, post-storm recovery. The timing of weather events matters more than the event itself.
7. Historical Success
YOUR catch density in radius. More catches near a spot under similar conditions = higher confidence in the forecast.
8. Time of Day
Golden hours around sunrise and sunset. Dawn and dusk feeding windows are weighted heavily for most species.
9. Tide Stage
Saltwater and coastal only. Incoming, outgoing, slack — each stage concentrates bait and predators differently.
10. Moon Phase & Solunar Periods
Major and minor solunar periods, new and full moon effects. Decades of fishing science baked into every score.
11. Water Stability Index
Lake currents, upwelling patterns, and thermocline depth. Stable water means predictable fish. Unstable water means the rules change.
12. Custom User Weights
You decide which factors matter most. Pressure junkie? Crank it up. Don't care about moon phase? Turn it down. YOUR forecast, YOUR rules.
Bite Window Calculator
Hour-by-hour fishing probability so you know exactly when to be on the water.
Hour-by-Hour Probability
Every hour gets a fishing probability score from 0 to 100. The calculator combines solunar periods, moon phase, time of day, pressure trends, temperature, wind, and YOUR historical catch data to produce a personalized hourly timeline.
Quality Ratings
Each hour is rated Excellent, Good, Fair, or Poor so you can see your best windows at a glance. No guesswork. No spreadsheets. Just clear, visual guidance.
YOUR Data Matters Most
Generic solunar charts are the same for everyone. Get Hooked! layers YOUR catch history on top. If you consistently catch fish at 7 AM on rising pressure days, that window gets boosted — because YOUR patterns are the strongest signal.
Catch Pattern Analytics
Get Hooked! automatically discovers patterns in your fishing success that you might never notice on your own.
"You catch more smallmouth in overcast conditions"
"Your best times are 6-9 AM and 5-7 PM"
"You catch 40% more when barometric pressure is rising"
Historical Match Scoring
Before each trip, Get Hooked! scans your entire catch history and finds days with similar conditions. It reports a match percentage so you know how closely today's environment mirrors your most successful outings. High match? Get on the water. Low match? Maybe wait for a better window.
Cross-Spot Intelligence NEW
"Try this spot you've never fished" — personalized recommendations based on YOUR catch history.
Condition Fingerprinting
Get Hooked! builds a per-species environmental fingerprint from your catches — water temp, pressure trend, wind, cloud cover, flow, and more. When a spot you've never fished matches your walleye fingerprint at 82%, you'll know before anyone else.
Negative Signal Detection
It's not just about what works. Cross-Spot Intelligence tracks conditions where you've never caught a species. East wind and zero walleye days? That spot gets suppressed, even if everything else looks good.
Time-of-Day Gating
If your walleye pattern says "morning" and it's 3 PM, the app won't recommend a 50-mile drive. Recommendations are filtered by current time and your historical catch windows.
Trend-Aware Wisdom
Not just "pressure is falling" but "pressure started falling 2 hours ago — your best catches happen in the first 4 hours of a drop." Cross-Spot Intelligence understands when within a trend you catch fish, not just that you do.
Intel Tab — Top-Level Discovery
The Forecast screen has three tabs: Intel, My Forecasts, and Suggested. Intel uses your GPS to scan nearby waterway gages (10-100 mile radius) and surfaces spots you've never fished that match your species patterns right now. Match percentage rings, dimension breakdowns, and tactical advice — bait, time, gear.
Proactive Alerts
"3 spots match your walleye pattern today" — pushed to your phone before you even open the app. Tap to see the Intel tab with full recommendations and navigate directly.
Most apps tell you what the weather is. Get Hooked! tells you where to go, what to throw, and when to be there — based on conditions that have produced YOUR catches.
Auto-Generated Forecasts
No setup required. Just fish and the system learns.
Fish Your Spots
Log catches wherever you go
Clusters Detected
The app detects clusters of your waypoints automatically
GH Suggestions Appear
A suggestion queue of forecast spots is generated -- each with a map preview showing a radius circle, nearby pins, and an interactive detail sheet
The more you fish, the smarter it gets. No configuration screens. No manual location pinning. Get Hooked! watches where you fish and builds your forecast library automatically. Accept a suggestion with one tap, or dismiss it and move on.
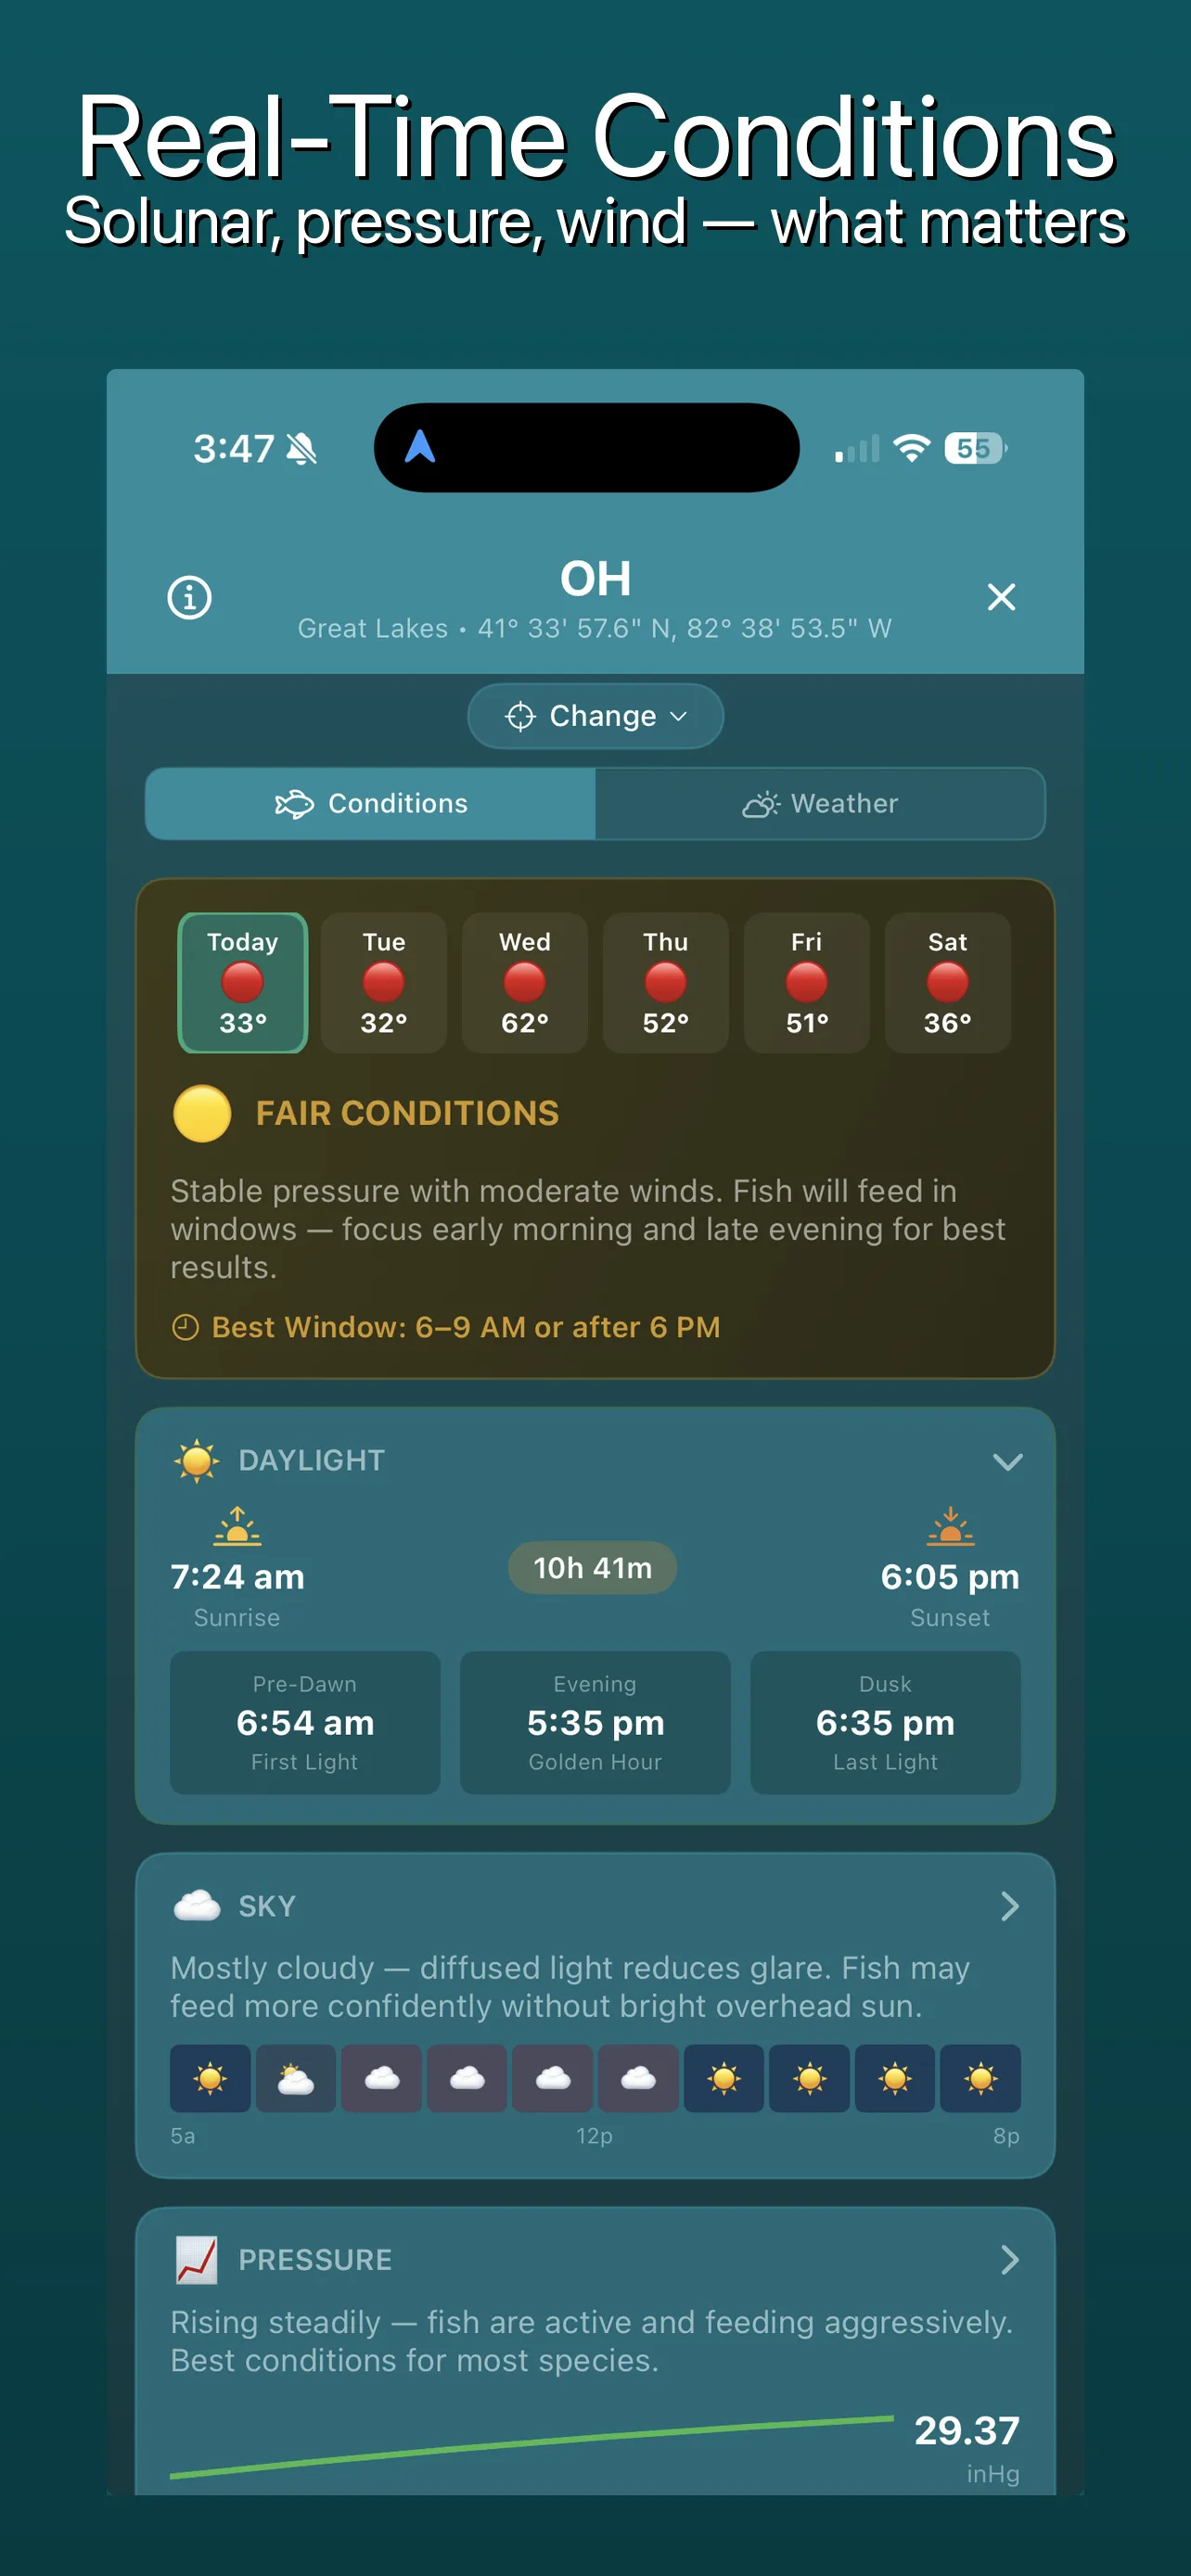
Conditions Screen
Two ways to view conditions: what they mean for fishing, or the raw data behind them.
Knowledge-First Tab
Fishing-relevant interpretations of current conditions. Every data point is translated into what it means for you on the water.
- Quick verdict cards
- Solunar activity periods
- Tide stage interpretation
- River flow assessment
- Sky conditions impact
- Wind effect on fishing
- Wave / swell analysis
- Daylight windows
- Moon phase significance
- Pressure trend direction
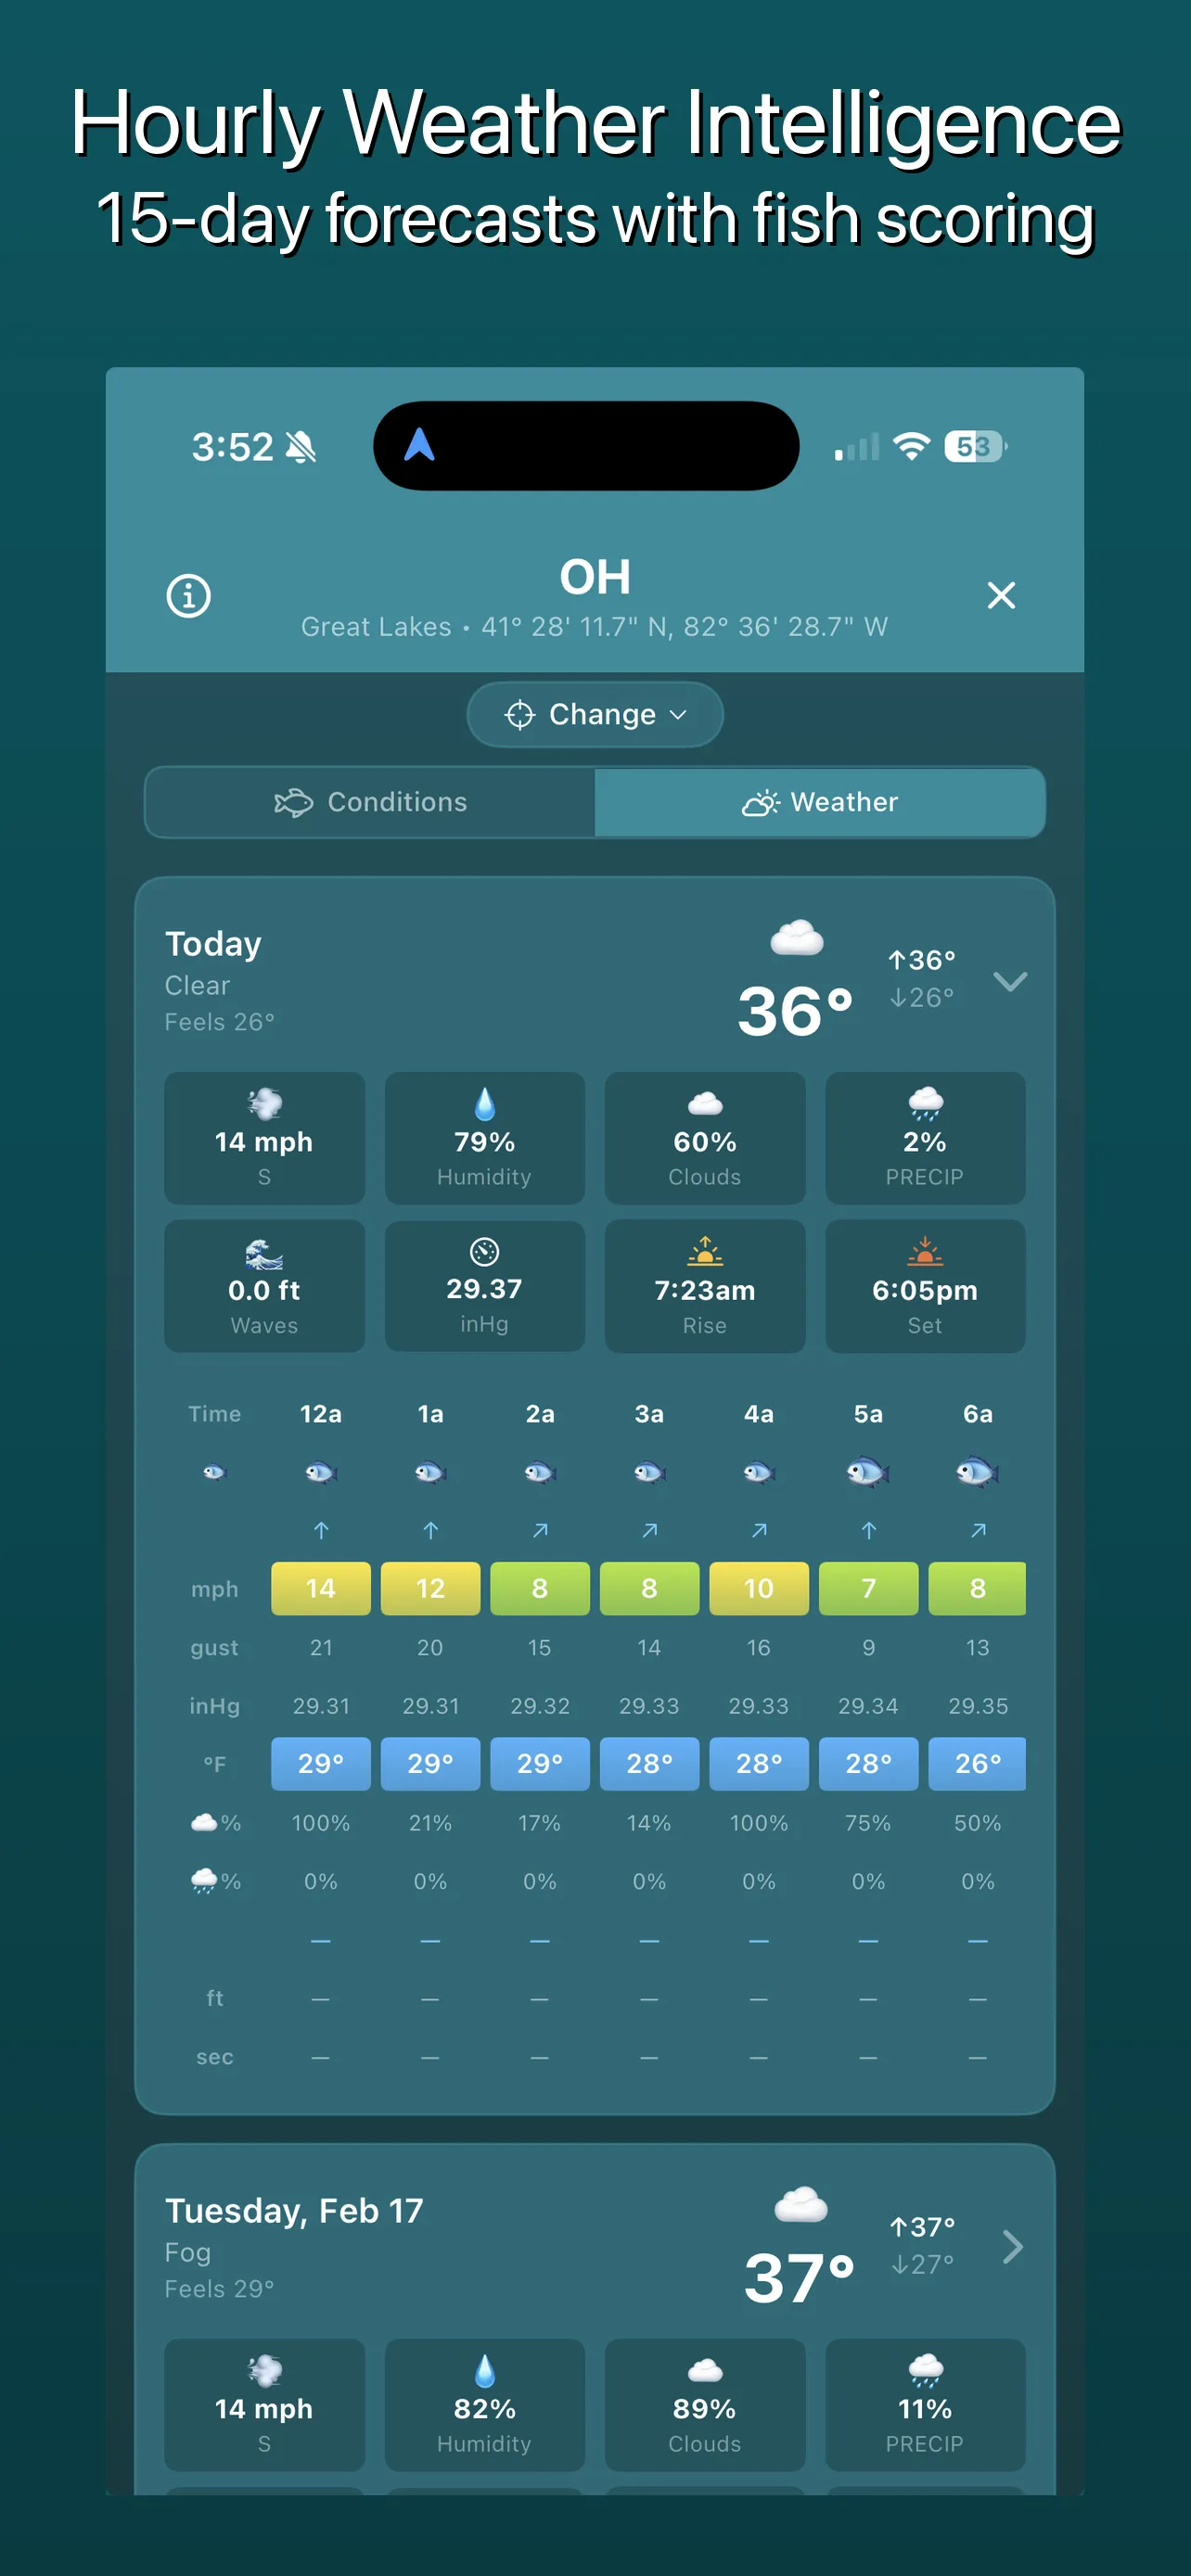
Weather Tab
Full weather data with a Windy-style hourly grid that scores every hour for fishing. The numbers, the context, and the fish scores -- all in one view.
- 15-day forecast cards
- Hourly weather grid with 7-factor fish scoring per hour
- Fish icons sized by score (large 70+, medium 45-69, small <45)
- Wind direction arrows & pressure gauges
- Cloud cover, sunrise/sunset markers
- Change location pill for quick context switching
Forecast Report Card NEW
The forecast learns from every trip. This is how.
Dual Grading System
Every trip gets two A–F grades: a Trip Grade (how well you fished, ranked against your own history) and a GH Grade (how accurate the forecast was). When GH gets a D or F, the app tells you exactly which scoring factors were off — and offers to fix them.
Pattern Detection
After 3+ graded trips, the Report Card runs Pearson correlation analysis across all 12 scoring factors to find which ones actually predict YOUR fishing success. Factors that consistently drag your score down on good days get flagged.
Per-Factor Adjustment
Each graded trip shows which factor hurt the forecast the most. Tap to increase or decrease any factor's weight by 30% — one factor at a time, so you stay in control.
One-Tap Weight Optimization
After 8+ graded trips, if GH consistently underperforms, a calibration banner appears with an "Optimize All Weights" button. One tap rewrites your scoring weights using machine learning — Pearson correlations determine which factors deserve more influence and which need to be dialed back. A before/after preview shows exactly how your historical scores would change.
Before & After Preview
Before you commit, the Report Card shows your current average forecast score vs. the optimized average. See the improvement in numbers before tapping Apply.
Per-Location Learning
Weights are optimized per forecast location. Your lake spot and your river spot can have completely different scoring profiles — because the conditions that matter are different for each.
The result: a forecast that gets more accurate the more you fish. Not a generic model — YOUR model, trained on YOUR data, at YOUR spots.
Arrival Intelligence NEW
You arrive at a forecast location. Your phone already knows what works here.
Geofenced Catch History
Every forecast location is a geofence. When you physically arrive within the forecast radius, a notification fires with your seasonal catch history for that spot — top species, best bait, depth ranges, and year-over-year comparison. No tapping required.
Year-Over-Year Contrast
"This spring: 8 catches — Walleye, Crawler Harness, 28-32ft. Last spring (2025): 12 catches — Smallmouth, Minnow, 15-20ft." See how your patterns have shifted season to season at the same spot.
Seasonal Filtering
Arrival Intelligence shows catches from the current month ±1, bucketed by year. Spring catches when you arrive in spring, summer catches when you arrive in summer. If seasonal data is sparse, it falls back to all-time history.
Apple Watch Push
The arrival notification is also pushed to your Apple Watch — top species and best bait right on your wrist as you pull up to the dock. Once-per-day debounce per location keeps it from nagging.
Data Sources
Visual Crossing (15-day weather) · Open-Meteo Marine (waves) · NOAA (tides, alerts) · USGS (river data) · Your own catch history
Every forecast blends professional-grade environmental data with your personal fishing patterns. No other app combines all five.
Ready to stop guessing and start catching?
© 2026 Hooked on Yutz. Get Hooked! is a trademark of Hooked on Yutz.